
Recent reports indicate investor interest in global macro has been markedly increasing. At the same time, two seemingly contradictory narratives have emerged on the future of its development. On the one hand, there has been intense media focus and industry investment in machine learning and artificial intelligence—tools which lend themselves to a systematic approach, likely bringing far greater computational power and speed to analyzing markets than any group of human traders can. On the other hand, the return of macroeconomic shocks after a decade of relatively placid markets and persistently accommodative policy has led to a purported renaissance for discretionary traders, some of whom thrived in the turbulent years of 2020 through 2022.
One might assume that one or the other of these tailwinds will eventually come to dominate. That is, the future will belong either to machines, which aim to bring scale far beyond the limits of human cognitive capabilities, or to discretionary traders, aided by data and technology but ultimately calling the shots in a world of unpredictable macro shocks. While each of these narratives likely contain some truth, we believe the empirical record and intuition actually point to systematic and discretionary macro strategies coexisting over the long term, both as standalone strategies and as strong diversifiers to each other. In this Street View, we show that systematic and discretionary macro strategies:
- Have delivered similar average Sharpe ratios over the last ~15 years.
- Have been (on average) roughly uncorrelated over the same period, meaning the two have empirically been complementary.
- Intuitively, have different strengths—which we’d expect to be persistent through time.
As a result, we find that a portfolio which combines systematic and discretionary macro would have meaningfully outperformed either approach standalone since 2008—and we’d expect allocators who blend the two to outperform going forward.
In Part One and Part Two, we review the methodology of this analysis and empirical results.1 These results suggest systematic and discretionary macro funds capture different market drivers, and therefore may have different advantages. In Part Three, we discuss what these relative strengths may be and provide some concrete (though hypothetical) examples of instances in which they may be useful.
Part One: Methodology
Our analysis uses monthly net-of-fee returns, strategy descriptions, and assets under management for multi-asset2 macro hedge funds that self-report to Hedge Fund Research (HFR).3 We manually analyze strategy descriptions for all funds to classify their investment processes as either systematic or discretionary (using publicly available websites or marketing materials to supplement where needed).
Importantly, we exclude two types of funds from our analysis, as we believe both constitute their own peer groups distinct from diversified long-short global macro:
- Funds with strategy descriptions indicating structural market beta. These include risk parity funds and so-called “allocation funds” or “diversified growth funds.”
- Funds with strategy descriptions indicating price trend following as a concentrated style exposure.4 While price trend following is certainly a core macro trading style, and a component of many of the diversified funds we kept, investors seeking to gain exposure to concentrated price trend following can do so at lower fees than they would pay for a diversified macro fund seeking to generate returns from less commonly known signals (i.e., alpha).5 As such, we believe it makes sense to discriminate between funds providing primarily price trend exposure and more diversified global macro funds.
We pull returns from January 2008 through June 2023 and exclude funds with fewer than 36 months of data.6 For each firm, we keep only the longest-running track record within each of the systematic and discretionary universes.7 At many firms, signals or discretionary trades are shared across vehicles, and we don’t want to introduce mechanical correlation within each group or double-count certain investment processes. Selecting only a single track record per firm avoids these issues.
After the aforementioned filtering, the universe of this analysis includes 63 hedge funds classified as systematic macro and 72 hedge funds classified as discretionary macro.
Part Two: Empirical Results
We begin by looking at results using our systematic and discretionary universes broadly (with no filtering based on assets under management). The median pairwise correlation between systematic and discretionary macro funds has been low (0.06). The median pairwise correlation within each group has also been low (each rounding to 0.1), though a bit higher than the correlation between groups. Roughly equal correlation within groups indicates that systematic macro funds are not necessarily any more concentrated in similar, crowded trades than discretionary macro funds are.8
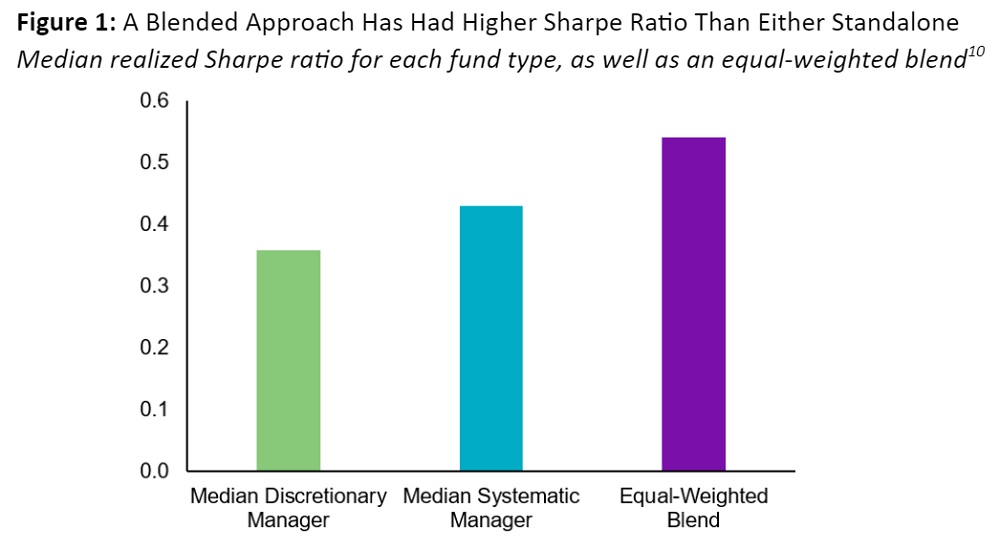
The systematic and discretionary groups have had roughly similar median Sharpe ratios—each rounding to 0.4.9 As shown in Figure 1, an equal risk-weighted combination of a median systematic and median discretionary fund has yielded a higher Sharpe ratio than either approach standalone, given the diversification benefit between them.
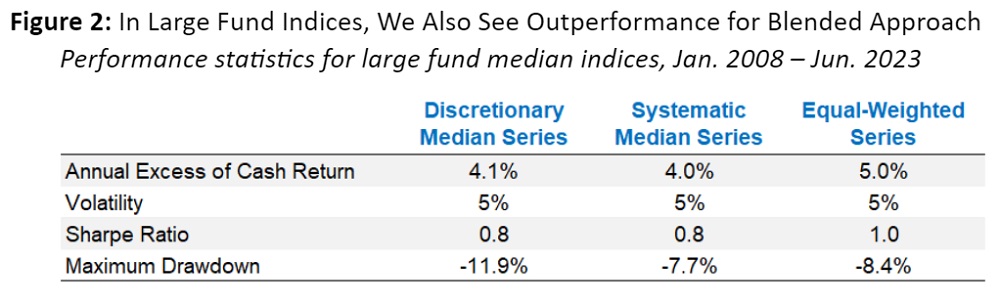
While analyzing the entire universe of managers maximizes our sample size, we recognize that a smaller set of large, institutional funds may be more relevant for most allocators. Therefore, for each macro approach, we also create a monthly index (i.e., time series) of the median net return across the 10 largest (by AUM) funds in each group.11 The group of 10 managers (for each macro approach) is updated every year based on prior year-end AUM values reported to HFR.
Figure 2 shows performance statistics for the large fund indices for each macro approach, as well as an equal risk-weighted combination of the indices. To make returns comparable, we scale each series in sample to 5% volatility. As in the broader universe results, the two approaches had very similar Sharpe ratios over the full period. (Note, however, that the Sharpe ratios between Figure 1 and Figure 2 are not directly comparable, as the Figure 2 Sharpe ratios embed diversification across 10 underlying managers, while the Figure 1 Sharpe ratios do not.)12 Because the two approaches have been diversifying, an equal-weighted combination has outperformed either standalone.
Interestingly, the systematic median series demonstrates a shallower maximum drawdown than the discretionary median series does. This stands in contrast to the notion that systematic funds are more likely to experience large drawdowns than discretionary funds are.13
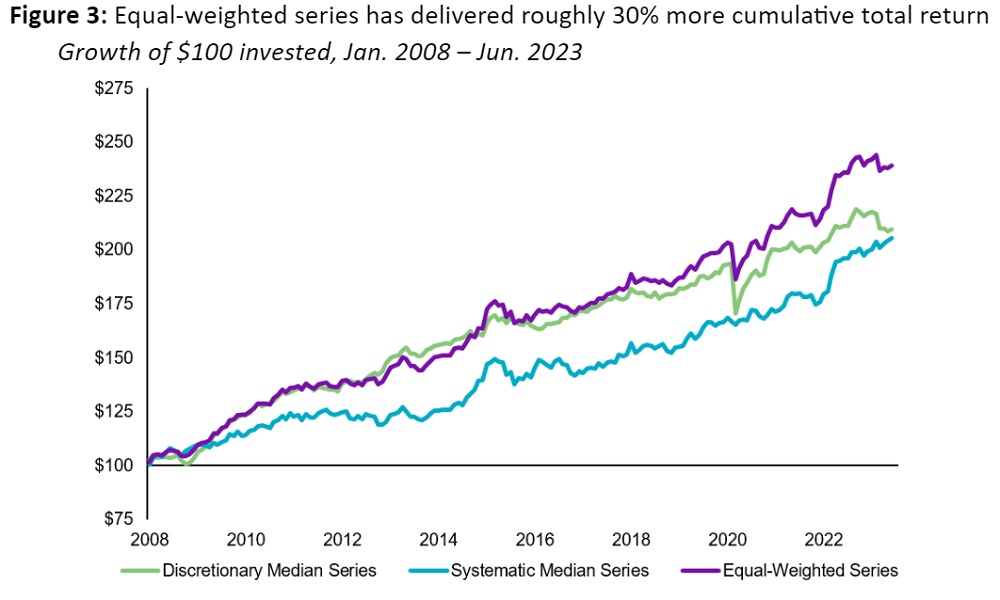
As shown in Figure 3 below, over the full 15+ year sample the equal-weighted series has delivered roughly 30% more cumulative return than has either standalone approach.
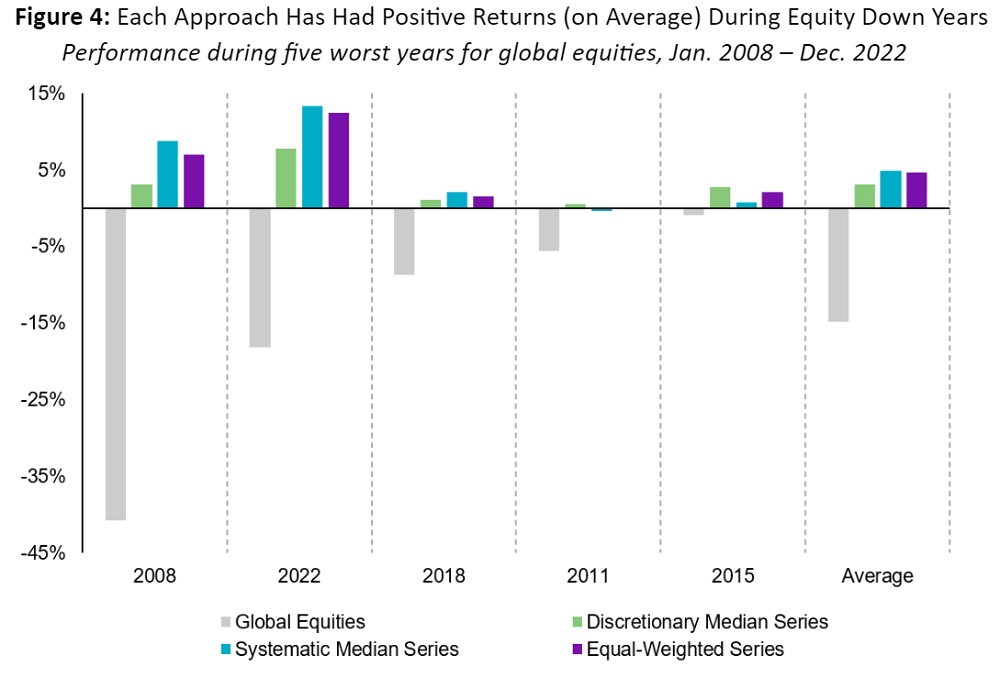
Recognizing the importance of diversification during difficult periods for equity markets, we also look at returns during the five negative years for global equities since 2008. For both the systematic and discretionary series (and the equal-weighted series) we do see a tendency towards positive performance during equity down years.
Part Three: Relative Strengths of Systematic and Discretionary Macro
Very low correlation (and yet similar Sharpe ratio) may be a bit surprising for investment strategies which share a common goal of predicting macro asset returns, and which reside in the same bucket for many allocators. To some degree, this may reflect the limitations of using returns-based analyses (in the absence of holdings or other more granular information). However, we believe the lack of correlation is also indicative of more fundamental differences; we summarize these below in three broad categories.
Scale vs. specificity
Systematic macro investment processes benefit from scale across several dimensions. First, they’re likely to incorporate and process many more datasets, incorporating more information in a single asset forecast than a discretionary portfolio management team can simultaneously consider. In addition, systematic macro processes tend to apply insights more broadly—analyzing assets across a greater number of regions and asset classes than a discretionary team could feasibly cover. Finally, systematic strategies may process data much faster and more continuously, allowing them to profit from short-term effects that discretionary investors cannot practically exploit. We believe all of these advantages of scale stem from leveraging computing power to make investment decisions, while discretionary strategies are inherently constrained by the limits and speed of human cognitive bandwidth.
However, a discretionary macro investor could counter that scale isn’t the most critical advantage, since only a few factors drive macro markets at any given time, and these are constantly changing. For example, U.S. inflation releases arguably mattered much more in 2021-2022 than they did in the several years preceding, as inflation reached multi-decade highs. Discretionary traders are often experienced observers of day-to-day market movements, giving them a better sense of prevailing market narratives than systematic researchers have, and potentially allowing them to be more nimble in deciding what matters most at any given point in time. Greater implementation flexibility may also permit a discretionary trader to express these views in more tailored ways—e.g., via less liquid instruments, or trades with multiple legs—whereas systematic managers tend to forecast in a standardized, instrument-by-instrument manner.
Of course, systematic processes can also prioritize different variables through time, using conditioners, time-varying model risk allocations, and other more advanced techniques. However, ultimately a human needs to program these features (and everything else) into systematic models. Market experience may build a kind of judgment that’s useful for ideating and refining this logic—and lived market experience is not scalable.
Differences in inputs
As noted above, systematic strategies are likely to consider many more inputs—but they’re also likely to consider different inputs. Some of these are infeasible for humans to manually analyze—e.g., social media posts or credit card data. Others could be incorporated in a discretionary process, but may only be sporadically useful – for example, timely and detailed geolocation or mobility data when assessing pandemic-related lockdowns. Discretionary firms, especially small or medium-sized ones, likely have smaller data budgets than comparably-sized systematic firms do, and therefore could be hesitant to acquire specialized datasets for one-off analysis. Moreover, even those which do may be behind systematic peers in cleaning, parsing, and analyzing it.
Meanwhile, discretionary investors likely have a leg up in incorporating non-quantifiable inputs. For example, geopolitical tensions between the United States and China may be hard to fully capture or quantify systematically, yet are consistently relevant to most macro strategies.
Analyzing persistent relationships vs. infrequent events
Systematic macro research is both empowered and limited by data availability. Where data exists, a systematic process is well equipped to extract insights in an empirically robust and objective manner, while carefully mitigating overfit (a risk present in both systematic and discretionary investment processes). These relationships may be technical or fundamental, short horizon or long horizon—but first and foremost, they must be testable.
Meanwhile, discretionary investors are more likely to form investment views based on infrequent events or structural breaks for which little or no analyzable data exists. For example, in Q2 2023, a known tail risk for all investors was the possibility that the U.S. Congress would fail to raise the debt ceiling, potentially resulting in missed U.S. government payments and/or a downgrade of the U.S.’s credit rating. While both systematic and discretionary managers needed to think through the risk management implications of a U.S. default, from an alpha generation perspective the two approaches were in different boats. Systematic models could hope to profit by capturing patterns which repeat around a wide variety of market events, but they are unlikely to invest based on debt ceiling negotiations specifically (these have too little analyzable data). However, a discretionary investor would be more likely to incorporate debt ceiling-specific news in alpha generation—taking views based on the progress of negotiations or market pricing of the implied probability of default.
Conclusion
Information drives alpha—so investors should consider adding strategies which capitalize on different inputs and methods of analysis. Systematic and discretionary macro are independently viable because they capture fundamentally different relationships. Their advantages are structural and therefore durable—no matter what technological disruptions lie ahead, it is likely that both systematic and discretionary macro strategies will coexist over the long term
At the same time, like most forms of investing, global macro is vastly complex and increasingly competitive. Successful allocators won’t want to compete with one hand tied behind their backs—they’ll ultimately need to leverage the advantages and insights of both approaches to outperform. To do otherwise would be to leave information, and therefore alpha, on the table.